
Small and independent American craft brewers contributed $67.8 billion to the U.S. economy in 2016. The figure is derived from the total impact of beer brewed by craft brewers as it moves through the three-tier system (breweries, wholesalers, and retailers), as well as all non-beer products like food and merchandise that brewpub restaurants and brewery taprooms sell. [...] The industry also provided more than 456,000 full-time equivalent jobs, with more than 128,000 jobs directly at breweries and brewpubs, including serving staff at brewpubs.
On Tuesday, the [U.S.] Brewers Association (BA) released the 2017 edition of its Economic Impact Report, a biennial analysis featuring the economic contribution of 'craft' brewing of all fifty states and the District of Columbia. It assembled those data (from 2016) in five categories, by state:
- Total Economic Contribution
- 1. California $7.3 billion
- 2. Pennsylvania $5.8 billion
- 3. Texas $4.5 billion
- 4. New York $3.4 billion
- 5. Florida $3.1 billion
[...]- 51. Rhode Island $152.3 million
- 2. Pennsylvania $5.8 billion
- 1. California $7.3 billion
- Economic Contribution, per capita
- 1. Colorado $764.34
- 2. Vermont $666.78
- 3. Oregon $659.12
- 4. Pennsylvania $615.77
- 5. Montana $549.98
[...]- 51. Mississippi $148.33
- 2. Vermont $666.78
- 1. Colorado $764.34
- Craft Jobs
- 1. California 49,308
- 2. Pennsylvania 39,841
- 3. Texas 26,506
- 4. Florida 23,077
- 5. Colorado 22,220
[...]- 51. Wyoming 1,108
- 2. Pennsylvania 39,841
- 1. California 49,308
- Craft Labor Contribution
- 1. California $2.71 billion
- 2. Pennsylvania $1.87 billion
- 3. Texas $1.42 billion
- 4. New York $1.31 billion
- 5. $1.05 billion
[...]- 51. Rhode Island $55.3 million
- 2. Pennsylvania $1.87 billion
- 1. California $2.71 billion
- Average Craft Wage
- 1. Washington, D.C. $64,300
- 2. New York $59,952
- 3. Oklahoma $57,167
- 4. California $55,019
- 5. Connecticut $54,755
[...]- 51. Mississippi $38,176
- 2. New York $59,952
- 1. Washington, D.C. $64,300
The BA offers two lists at its website —the top five states for economic contribution and the top five for per capita economic contribution— and the same on an interactive map. The remainder of the state data is available in a pdf table, with the states listed alphabetically. I spent a few minutes to enter the data into a spreadsheet, sorting by rank in each of the five categories. Here: the state rankings, by total economic impact.
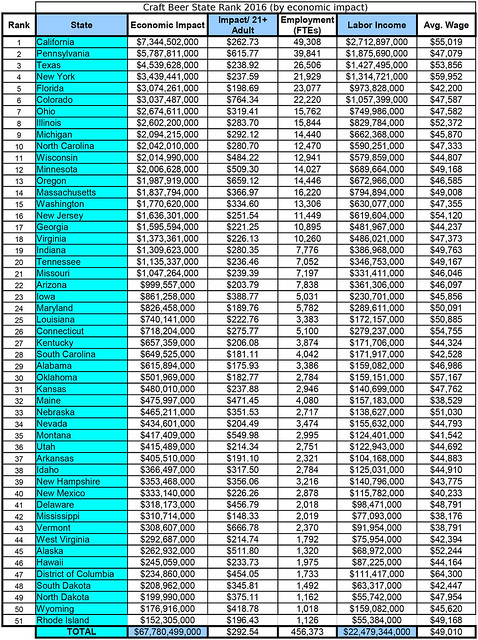
Go here to see a larger view of the table. Click each of the links above to see the state data sorted by the other four categories.
California dominates —as would be expected by its size— in total economic contribution, craft jobs, average wage, and the economic contribution of those jobs. It falls out of the top five in per capita impact (to 27th), where the top spot is held by Colorado. Pennsylvania is also a powerhouse appearing in the top five for four of the five categories: economic contribution, per capita contribution, jobs, and labor contribution. In terms of a state's average craft beer wage, the best in the nation is Washington, D.C., offering its beer workers an average wage of $64,300. The worst in the U.S. is Mississippi, at $38,176.
According to the BA, the data for this Economic Impact Report is based on two national surveys it conducts: the annual Beer Industry Production Survey (BIPS) and the bi-annual Brewery Operations Benchmarking Survey (BOBS), as well as additional government and market data. The BA then entered the data into an IMPLAM software input-output analysis "in order to examine the broader ripples of craft brewers in the national and state economies." Breweries that did not fit the BA's criteria for 'craft' brewery were not included. In addition, the association excluded non-beer beverage alcohol products of craft breweries such as cider and flavored malt beverages (FMB), while including certain other non-beer products such as food at brewpubs.
Unlike the BA, the Beer Institute looks at the U.S. beer industry as a whole. Its most recent data show that the U.S. beer industry provided jobs to nearly 2.23 million Americans, contributed over $350 billion to America’s economy, and paid $63.5 billion in annual taxes. Brewers and importers directly employed 64,745 Americans. Suppliers to the brewing industry employed more than 491,800 Americans. Beer wholesalers directly employed more than 134,240 Americans. Beer retailers employed 915,700 Americans.
Comparing statistics produced by different methodologies can be problematic, but, nonetheless, the BA's Economic Impact Report shows that 'craft' beer stands well compared with the entire beer industry: contributing an economic impact of $67.8 billion produced via 456,000 full-time equivalent jobs. I'd say those are significant contributions.
Bart Watson is the chief economist for the BA, ultimately responsible for preparing this report. I'll leave it to him, and others smarter than me, to 'drill down' and offer more thorough analysis.
-----more-----
- According to the BA, the IMPLAN model was first developed by the U.S. Forest Service(!). It looks at the interconnections between sectors of the economy, tracing flows of dollars and employment both nationally and at the state level. These interactions are based on industry-specific multipliers derived from government data and the econometric calculations of the model. See the full statement of methodology: here (pdf).
- The Brewers Association defines 'craft' brewery, that is, its member breweries, as:
- Small
Annual production of 6 million barrels of beer or less (approximately 3 percent of U.S. annual sales). Beer production is attributed to the rules of alternating proprietorships. - Independent
Less than 25 percent of the craft brewery is owned or controlled (or equivalent economic interest) by an alcoholic beverage industry member that is not itself a craft brewer. - Traditional
A brewer that has a majority of its total beverage alcohol volume in beers whose flavor derives from traditional or innovative brewing ingredients and their fermentation. Flavored malt beverages (FMBs) are not considered beers.
- Small
- More from the [U.S.] Brewers Association:
- BA press release: here.
- The interactive state map (for economic contribution and per capita contributions only): here.
- All state impact data: here (spreadheet as pdf).
- The BA also supplies a graphical look at each state's craft beer statistics. It has not yet been updated with these latest data but does include each state's brewery count and number of barrels produced annually. At its website: here.
- All the spreadsheets as jpegs at Flickr: here.
- The BA's production numbers for craft beer in 2016: here. Adn, as summarized by DRAFT: here.
- As Georgia has become the new(ish) HQ for YFGF, it would be fitting to highlight that state's standings.
- 17th in total economic impact: $1,595,594,000
- 38th in per capita impact: $221.25
- 17th in craft beer industry jobs: 10,895
- 18th in income produced by those jobs: $481,967,000
- 40th in average industry wage: $44,237
- For more from YFGF:
- Follow on Twitter: @Cizauskas.
- Like on Facebook: YoursForGoodFermentables.
- Follow on Flickr: Cizauskas.
- Follow on Instagram: @tcizauskas.


No comments:
Post a Comment
Comment here ...